
1.2 Mapping the World
-
1.2 Mapping the World
-

 Ich kann...
- ... eine Karte beschreiben und analysieren, bzw. deren Stärken und Schwächen analysieren und diskutieren.
- ... Daten aus interaktiven Karten interpretieren und in meine Analysen einfließen lassen.
- ... die wichtigsten Indikatoren der globalen Entwicklung nennen.
- ... relevante Informationen zu jedem Indikator auf einem Faktenblatt zusammenfassen.
- ... die wichtigsten Merkmale und Daten der Indikatoren präsentieren.
- ... die unterschiedlichen Entwicklungsindikatoren miteinander vergleichen und deren Vor- und Nachteile erläutern.
- ... die Grenzen des GDP als alleinigen Indikator für Wohlstand und Entwicklung kritisch hinterfragen.
- ... in der Klasse über die Bedeutung der verschiedenen Indikatoren diskutieren und unterschiedliche Perspektiven einbringen.
- ... Argumente für die Verwendung alternativer Indikatoren zur Bewertung des Entwicklungsstands eines Landes formulieren.
- ... Informationen klar und anschaulich präsentieren, um die Zuhörer zu informieren und zu überzeugen.
- ... visuelle Hilfsmittel effektiv nutzen, um die wichtigsten Punkte meiner Präsentation zu unterstützen.
-
Teilnehmer/innen müssenAls erledigt kennzeichnen
Intro: Mapping the World




In geography textbooks we often find the following groupings of countries: Industrialised Countries (ICs), Emerging Countries / Countries in Transition, Less Developed Countries (LDCs), Least Developed Countries (LDCs), Landlocked Developing Countries (LLDCs).
Take markers of different colours and identify and label countries on the map.

Find the countries mentioned in the classification on the map and colour them in according to the colours in the legend.
The following classification can help you to colour the countries according to their category.
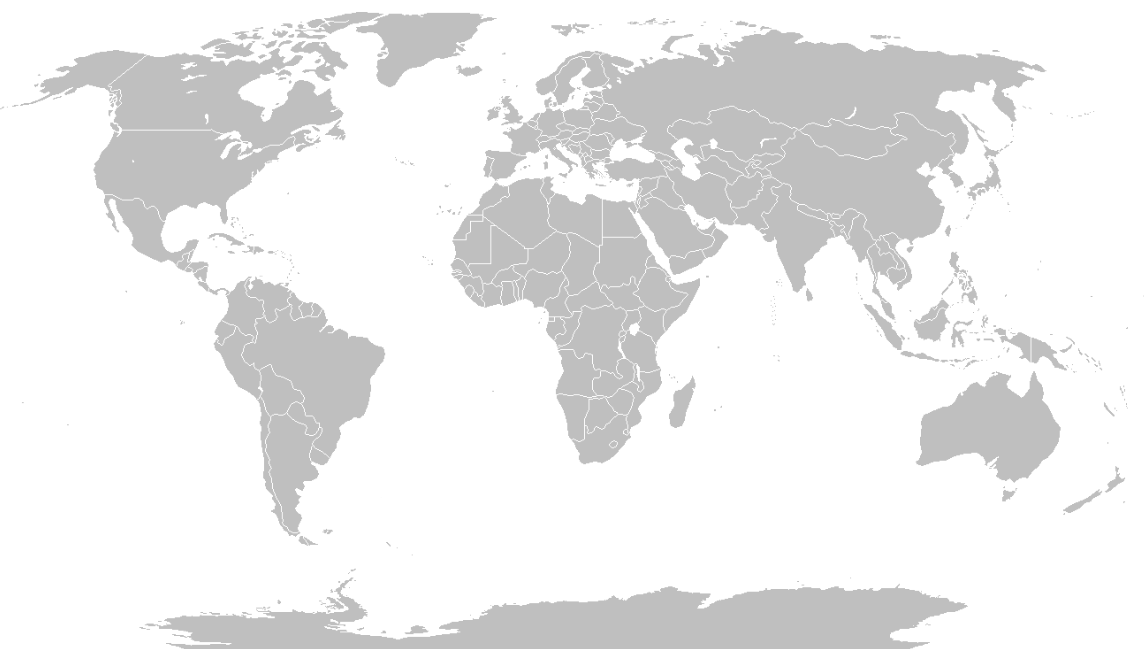
Grafik: https://commons.wikimedia.org/wiki/File:World_Map_Blank.svg by Petr Dlouhý

2. Compare your maps in small groups and discuss differences.
-
Teilnehmer/innen müssenAls erledigt kennzeichnen
Activity 1: Working with classifications



GROUP A
M1 Globaler Norden und Globaler Süden


1. Discuss the title and color division of the map with a partner. Here you can find language support.

2. Go to the website of the German Federal Ministry for Economic Cooperation and Development (BMZ) and read the following glossary entry "Global South/Global North". Summarise the content in English.
3. What's the message of the map? Check out your knowledge in the activity.
Describe the map and write down five statements. Here you will find language help to describe and evaluate geographical maps.
 4. Discuss in small groups whether the terminology is appropriate to talk about global inequalities. Compare the classification of countries with the map from the activity above and identify difficulties in classifying countries.
 5. Prepare a short presentation of the results of your work for your class.
______________________________________________________________________________________________________________________
GROUP B
1. Go to the following internet page of the World Bank Group. Compare your map (see intro) with the World Bank's country classification and identify the differences.
2. Click on the play button above the map and observe the changes happening between 1987 and 2022.
Now complete the following statements in the interactive exercises.
Describe the map. Explain the developments shown between 1987 and 2022 and write down five statements.
Here you will find language help to describe and evaluate geographical maps. 3. In small groups, discuss what the World Bank Group map shows and doesn't show.4. Prepare a short presentation of the results of your work for your class.____________________________________________________________________________________________________________________
 Based on your findings, discuss in class whether the classification systems are suitable for measuring development and identify strengths and weaknesses.
-
Activity 2: Defining Development - From Concepts to Realities




Form groups of three. Write a definition of the term “development” on the placemat. Write at least three sentences. You could start like this: “Development is a concept that describes...”.Consider the following aspects:
- What is meant by development?
- Who defines what development is?
- How should development be measured?
- Who measures development?
Critically review the written definition(s), considering the following questions:
- Is there a ranking of countries/regions/people? Can you explain why?
- According to your definition is Europe more developed than other continents? If yes, can you justify that?
- Have you taken into account different aspects like the economy, the environment or society?
Post your definition in the board. Read at least three other definitions and leave a comment.

Discuss in class: Would people from other countries in the world agree with your concept of development?
-
Task: Workshop "Rethinking Development"


There are already many approaches and indicators that try to measure and map development. As part of the workshop "Rethinking Development", you will work in small groups on these indices.
Here you can find the agenda of the workshop.
 GROUP 1: Gross Domestic Product (GDP)
 GROUP 2: Human Development Index (HDI)
 GROUP 3:Happy Planet Index (HPI)
 GROUP 4: Gini Index
 GROUP 5: Big Mac Index (BMI)
 GROUP 6: Gender Inequality Index (GII)

Take a look at the following key questions and include them into your presentation.
 Leave your fact sheets in the student folder.
-
