
1 .1 Investigating Disparities
-
1 .1 Investigating Disparities
-
Teilnehmer/innen müssenAls erledigt kennzeichnen

 Ich kann...
In diesem Lernschritt lerne ich Folgendes:
- ... den durchschnittlichen Deutschen mit dem Durchschnittsmenschen eines Entwicklungslandes vergleichen und dabei sowohl Unterschiede als auch Gemeinsamkeiten herausarbeiten.
- ... eigenständig relevante Daten von der UN und der Weltbank recherchieren, um ein umfassendes Profil zu erstellen.
- ... die Lebensbedingungen und den Entwicklungsstand verschiedener Länder sowie deren Bewohner anhand der gesammelten Daten vergleichen.
- ... verschiedene Aspekte der Unterentwicklung identifizieren und in einer Mindmap visualisieren.
- ... verschiedene Methoden wie den "Trendalyzer" oder die Analysespinne verwenden, um Daten zu analysieren.
- ... die Ergebnisse meiner Analyse präsentieren und die Entwicklungsunterschiede erklären.
- ... methodisch arbeiten und die Aussagekraft verschiedener Methoden vergleichen.
- ... statistische Daten im Netz recherchieren.
- ... mit Hilfe statistischer Daten einen informativen Text verfassen.
-
Teilnehmer/innen müssenAls erledigt kennzeichnen
Intro: Let´s guess!



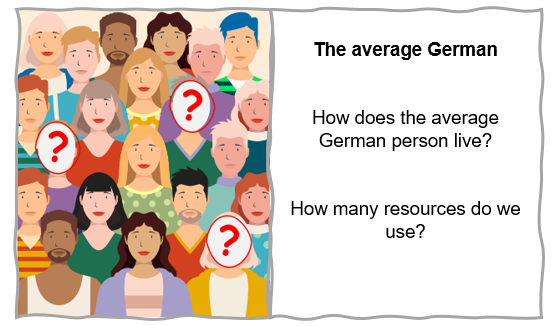 unsplash+
 Work in small groups to complete the table in the collaborative document with your own data. In most cases, you will have to make an educated guess. Compare your results and discuss any differences.
height
waste / year
weight
water consumption in l / day
life expectancy
data volume / month
years at school
living space m² / person
calories / day
meat consumption kg / year
pieces of clothing / year
kilometres / year (car)
rolls of toilet paper / year
CO2 / year
-
Teilnehmer/innen müssenAls erledigt kennzeichnen
Activity 1: The average German

Read the text about the average German and compare the information in the text with your own. How close were you to the numbers? Where were you furthest from the average? What information surprised you the most?

Discuss in small groups.
-
Teilnehmer/innen müssenAls erledigt kennzeichnen
Activity 2: Mapping Humanity - A Global Pinboard
 In teams of two, take a look at the pinboard. With a partner make assumptions about ...
 ... life expectancy.
 ... life expectancy and fertility rate.
 ... life expectancy, fertility rate, GDP per capita ($) and Co2 emission per capita (t).
Take notes on the worksheet and then compare with the hotspot image.
life expectancy fertility rate GDP per capita ($) Co2 emission per capita (t)
source: UNData (2025); fotos: unsplash+/wikimedia

3. Choose one picture and locate the country in an atlas (e.g. Diercke International Atlas). Complete the profile ...
 ... about this person's country.
 ... and write a text about the average person of that country (comp. in activity 1).
 ... and write a text about the average person of that country (comp. in activity 1). Look at the UN data: what general trends can you see when you compare the data for 2010, 2015 and 2025? Prepare 3-5 statements about what conclusions can be drawn.
 Check the following websites for reliable information:
United Nations UNData
- Worldbank https://data.worldbank.org/country
Bundesamt für Statistik https://www.destatis.de/EN/Themes/Countries-Regions/International-Statistics/_node.html
 Leave your profiles in the student folder.
 Present your profiles in class and discuss key questions and development trends.
 Use the glossary to keep track of new terms and concepts.
-
Teilnehmer/innen müssenAls erledigt kennzeichnen
Activity 3: Characteristics of underdevelopment
About 85% of the world´s population today live in countries with relatively low levels of development in economic, social and political terms.




Think of characteristics that are typical of many so-called "underdeveloped countries" and make a list.
 Share your ideas with a partner and complete the mindmap together.
If you are running out of ideas, have a look at these suggestions.
Here you can practise the technical terms with the dialogue cards or with this matching exercise.
Here you can check whether you have assigned all the characteristics correctly in the drag and drop activity.
 Compare your ideas with the list and add more facts to your mindmap.
-
Task Group A: Let´s "trendalyze" at Gapminder World



Trendalyzer is an information visualization software for animated bubble charts. It has five variables: Two numeric variables on the X and Y axes, bubble size and colour, and a time variable that can be manipulated with a slider.
1. Open the program: http://www.gapminder.org/world.
2. Select two different indicators that allow a classification into LDCs, emerging countries and industrialized countries.
3. Using three example countries over time, illustrate the typical characteristics of these country types (LDC, emerging market and industrialized country) in relation to the indicators you have chosen.
Make assumptions about the informative value of this method. Then compare your ideas with the document "Strengths and weaknesses of the Trendalyzer".
4. Create a screenshot and present your results. Compare this method with the radar charts of Group B and evaluate the informative value of both methods.
 Place your screenshot in the student folder.
 Check in the activity if you can match the characteristics, advantages and disadvantages of the two methods.
-
Task Group B: Creating a Radar Chart
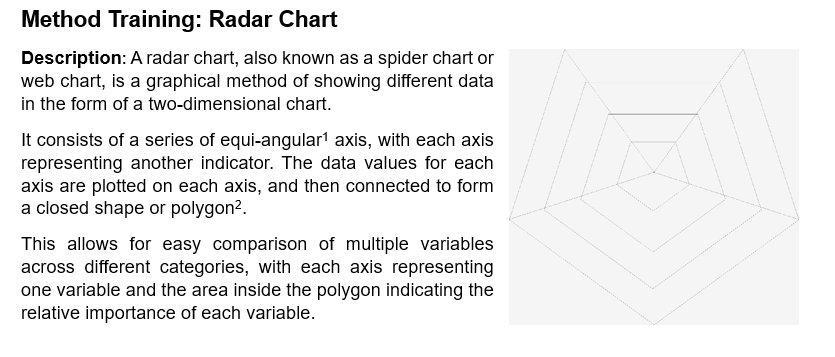


Complete the radar chart with data from three different countries.
If you need support on how to complete the graph, take a look at the following method page.
 Make assumptions about the informative value of this method. Then compare your ideas with the document "Strengths and weaknesses of radar charts".
 Present your results in class. Compare this method with the "Trendalyzer screenshots" of Group A and evaluate the informative value of both methods.
 Leave the completed radar chart in the student folder.
 Check in the activity if you can match the characteristics, advantages and disadvantages of the two methods.
-
Teilnehmer/innen müssenAls erledigt kennzeichnen
Reflexion: Wahrnehmungsfilter
In diesem Lernschritt hast du erste Zahlen, Bilder und Charakteristika von sogenannten Entwicklungsländern kennengelernt. Nun wollen wir diese Aspekte kritisch hinterfragen:
https://www.oncoo.de/sg9s für die Lehrkraft (Evaluation oncoo.de)

Wie hat sich eure Sicht auf die so genannten "Entwicklungsländer" im Laufe dieses Lernprozesses verändert? Welche "Vorurteile" haben sich bestätigt?
Inwiefern beeinflussen und verzerren statistische Daten zu Lebenserwartung und Geburtenrate unsere Wahrnehmung? Welche Vor- und Nachteile haben statistische Daten in Bezug auf diese Faktoren?
Inwiefern haben die Fotos der "Global Pinboard" deine Erwartungen verzerrt oder erfüllt? Diskutiert, welche Auswirkungen dies auf die Wahrnehmung und das Verständnis von Entwicklungspolitik haben kann.
Wie können wir unsere eigenen Perspektiven erweitern, um die Lebensrealitäten anderer Menschen besser zu verstehen?
-
Teilnehmer/innen müssenAls erledigt kennzeichnen
Ergebnissicherung
-
Teilnehmer/innen müssenAls erledigt kennzeichnen
Materialien und Aktivitäten
-