
1 Measuring Development
-
1 Measuring Development
-
Teilnehmer/innen müssenAls erledigt kennzeichnen

 Ich kann...
- ... relevante Merkmale von (Unter)Entwicklung identifiziern.
- ... Entwicklungsgrade verschiedener Länder analysieren.
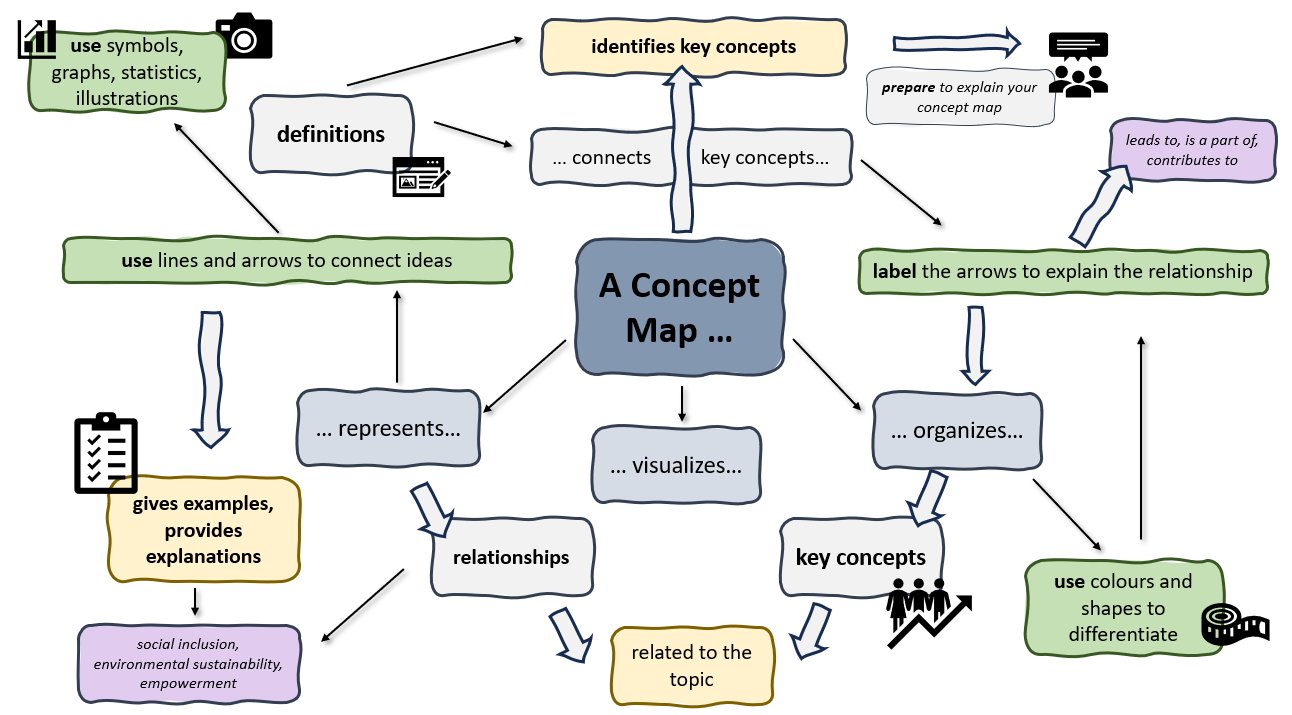
- ... den Begriff "Entwicklung" definieren und in einer Concept Map die verschiedenen Aspekte und Zusammenhänge visualisieren.
- ... eine vergleichende Analyse der Lebensbedingungen durchführen, indem ich die Daten zu verschiedenen Entwicklungsindikatoren für ein Land und eine ausgewählte Familie zusammentrage.
- ... beurteilen, welche Indikatoren besonders geeignet sind, um Unterschiede in der Entwicklung zu messen.
- ... verschiedene Klassifizierungssysteme vergleichen, wie das Bruttonationaleinkommen pro Kopf (GNP) und den Human Development Index (HDI).
- ... die Vor- und Nachteile des Bruttonationaleinkommens (GNI) pro Kopf als Indikator für den Entwicklungsstand eines Landes benennen.
- ... meine Ergebnisse visualisieren und in der Klasse präsentieren.
- ... mit verschiedenen Klassifizierungsystemen arbeiten und aus deren Daten Schlussfolgerungen ziehen.
- ... komplexe Inhalte mit einer Concept Map visualisieren.
- ... Daten recherchieren und diese systematisch in einer Tabelle oder einem Diagramm organisieren.
-
Intro: Measuring Development




Make a list of what you can measure to determine the level of development of a country. Use the clues to help you.

-
Activity 1: Defining Development




Working in small groups, create a concept map showing aspects that help answer the question: "What is development?" Consider different attempts at classification and their strengths and weaknesses.
See the instructions or an example if you need help making a concept map.
Go to LS 1.2 (Activity 2) if you need guiding questions or example definitions to support you.
-
 Assignment: Faces of Development - Analyzing Global Diversity




In an increasingly interconnected world, it is vital to understand the development situation in different countries. By examining the lives of families from different backgrounds, we can gain insight into the wider socio-economic factors that affect their daily lives.
Assignment Part 1:
1.1 Select a family: Visit the Dollar Street website and browse through the families. Choose one family that captures your interest.
1.2 Analyze the family's living conditions: As you explore the family’s photos, identify and note down characteristics (comp. LS 1.1 Activity 2) that reflect their development situation. Consider aspects such as:
family size housing/living conditions occupation transportation
1.3 Research and organize relevant data: Use UN resources (UNData) to find data that corresponds to the characteristics you have identified. Create a data table or chart to systematically organize the information you find.
þ life expectancy þ birth rate þ population age distribution þ literacy rate þ GDP per capita þ Co2 emissions per capita
Assignment Part 2:
Objective: Apply the six indicators of development (comp. LS 1.2 Assignment) to the family and country you selected in Part 1. Analyze how these indicators reflect the living conditions and development situation of your chosen family.
2.1 Research your family's country: For the country of your selected family, gather data on each of the six indicators: Gross Domestic Product, Human Development Index, Gender Inequality Index, Happy Planet Index, Big Mac Index and Gini Index. Use reliable sources such as UN databases or World Bank reports.
2.2 Create a comparative analysis: Organize your findings in a table or chart that includes the following columns:
- þ indicator: The specific development indicator (e.g., GDP, HDI).
- þ value: The numerical value or statistic for the country if available.
- þ category: The category the country falls into (e.g., low, medium, high) based on the indicator.
- þ implications: Briefly discuss what this indicator reveals about the living conditions and development situation of the family you selected.
Here is an example for a table.
2.3 Prepare your presentation: Integrate your findings from part 1 and part 2 into your visual presentation.
-
Teilnehmer/innen müssenAls erledigt kennzeichnen
Reflection
Use the Treasure Map to check whether you are familiar with the indicators of development. If you are not yet able to answer the questions, go to LS 1.2 and find out more in the workshop “Rethinking Development”.
-
Treasure Map "Rethinking Development"



-
Teilnehmer/innen müssenAls erledigt kennzeichnen
Material und Aktivitäten
-